DARPAN PUBLICATIONS INTERNATIONAL. LTD.
| COMPANY PERFORMANCE AT GLANCE | |||||
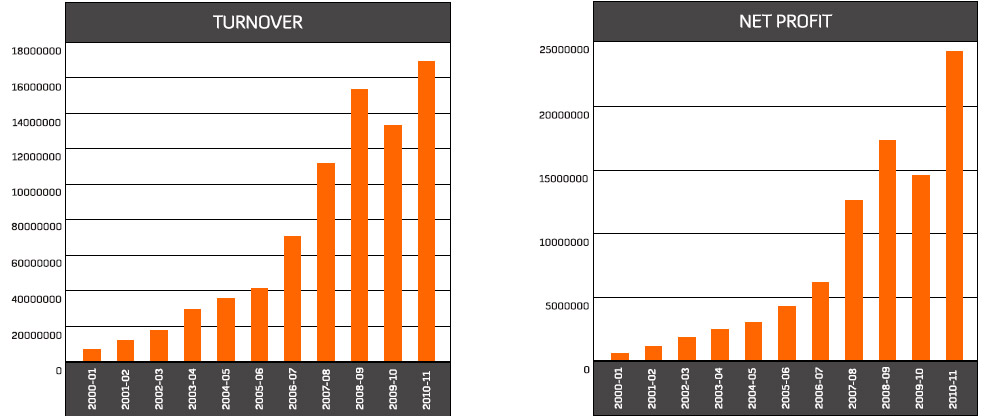
| Year | Turnover(INR) | Growth in Turnover | Net Profit After Depreciation(INR) | Growth in Profit(%) | Income Tax(INR) |
| 2000-01 | 4,067,594.00 | 64,256.00 | 33,090.00 | ||
| 2001-02 | 7,859,881.00 | 93.23 | 1,84,739.00 | 187 | 78,433.00 |
| 2002-03 | 17,630,281.00 | 124.31 | 21,94,453.00 | 1087.87 | 9,21,870.00 |
| 2003-04 | 28,135,508.00 | 59.59 | 24,10,964.00 | 9.87 | 9,11,684.00 |
| 2004-05 | 34,233,829.00 | 21.67 | 29,66,616.00 | 23.05 | 11,42,638.00 |
| 2005-06 | 41,239,778.00 | 20.46 | 4,545,217.00 | 53.21 | 1,074,643.00 |
| 2006-07 | 73,566,188.00 | 78.39 | 5,818,044.00 | 28.00 | 1,32,286.00 |
| 2007-08 | 114,724,556.00 | 55.95 | 12,798,383.00 | 119.98 | 2,248,869.00 |
| 2008-09 | 159,770,558.00 | 39.26 | 17,063,679.00 | 33.33 | 3,707,889.00 |
| 2009-10 | 138,903,641.44 | -13.06 | 15,042,610.00* | -11.84 | 3,864,481.00 |
| 2010-11 | 175,666,376.68 | 26.47 | 14,393,364.72 | 62.16 | 3,398,132.18 |
| GRAND TOTAL | |||||
*Figure as per income tax computation
As a Company, Darpan Publications Pvt.Ltd. has grown in leaps and bounds in the last 10 Years. Within a span of Eight Years(2001-11) Dppl’s sales has risen by over 43 times whereas profits spurted by over 379 times. This is a remarkable growth story. And, it was not achieved by a reckless spirit of adventure but by adopting a well calibrated business strategy.
Newspaper Sales
| Sales Growth – Newspaper Sales | |||||||
| Sales | Fy 9-10 | Fy 10-11 | Fy 11-12 | Fy 12-13 | Fy 13-14 | Fy 14-15 | Growth Over 5 Years |
| Figures in Lacs (INR) | |||||||
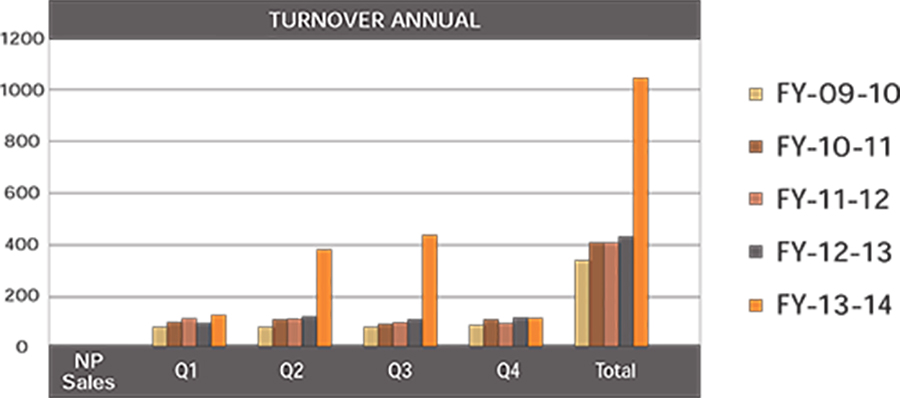
| 01 | 80.14 | 97.08 | 107.21 | 92.21 | 121.48 | 283.65 | 253.94% |
| 02 | 81.42 | 104.99 | 107.24 | 116.14 | 373.58 | 310.07 | 280.83% |
| 03 | 81.67 | 92.11 | 95.66 | 105.78 | 432.19 | 315.32 | 286.093% |
| 04 | 86.01 | 103.63 | 93.43 | 111.93 | 112.00 | 343.85 | 299.78% |
| Total | 329.24 | 397.81 | 403.54 | 426.06 | 1,039.25 | 1,252.89 | 280.54% |
Newspaper Printing Sales
| Sales Growth – Newspaper Printing Sales | |||||||
| Fy 9-10 | Fy 10-11 | Fy 11-12 | Fy 12-13 | Fy 13-14 | Fy 14-15 | Growth Over 5 Years | |
| Figures in Lacs (INR) | |||||||
| 01 | 188.63 | 120.65 | 255.57 | 310.44 | 154.63 | 184.90 | -1.98% |
| 02 | 129.66 | 147.95 | 235.93 | 372.63 | 149.06 | 189.86 | 46.43% |
| 03 | 121.58 | 186.38 | 249.09 | 334.07 | 178.53 | 165.16 | 35.849% |
| 04 | 124.94 | 233.43 | 243.35 | 259.24 | 132.08 | 158.77 | 27.08% |
| Total | 564.81 | 688.42 | 983.94 | 1,276.38 | 614.30 | 698.69 | 23.70% |

Commercial Printing Sales
| Sales Growth – Commercial Printing Sales | |||||||
| Fy 9-10 | Fy 10-11 | Fy 11-12 | Fy 12-13 | Fy 13-14 | Fy 14-15 | Growth Over 5 Years | |
| Figures in Lacs (INR) | |||||||
| 01 | 58.12 | 64.38 | 79.31 | 84.80 | 71.21 | 146.38 | 151.86% |
| 02 | 42.74 | 55.87 | 65.08 | 70.96 | 73.80 | 75.93 | 77.66% |
| 03 | 69.84 | 85.12 | 100.05 | 115.52 | 302.76 | 109.82 | 57.25% |
| 04 | 95.70 | 143.73 | 121.78 | 160.03 | 162.85 | 188.80 | 9728% |
| Total | 266.40 | 349.09 | 366.22 | 431.31 | 610.62 | 520.93 | 95.54% |

Advertisement Sales
| Sales Growth – Advertisement Sales | |||||||
| Advt. | Fy 9-10 | Fy 10-11 | Fy 11-12 | Fy 12-13 | Fy 13-14 | Fy 14-15 | Growth Over 5 Years |
| Figures in Lacs (INR) | |||||||
| 01 | 51.63 | 77.07 | 74.82 | 88.49 | 107.14 | 103.10 | 99.69% |
| 02 | 56.60 | 75.78 | 92.71 | 97.72 | 125.39 | 110.04 | 94.42% |
| 03 | 53.19 | 82.31 | 83.21 | 97.93 | 142.51 | 114.59 | 115.44% |
| 04 | 67.18 | 86.18 | 87.47 | 92.39 | 99.38 | 133.59 | 98.85% |
| Total | 228.60 | 321.34 | 338.21 | 376.53 | 474.42 | 461.32 | 101.80% |

Annual Sales Growth
| Annual Sales Growth | |||||||
| Sales | Fy 9-10 | Fy 10-11 | Fy 11-12 | Fy 12-13 | Fy 13-14 | Fy 14-15 | Growth Over 5 Years |
| Segment | Figures in Lacs (INR) | ||||||
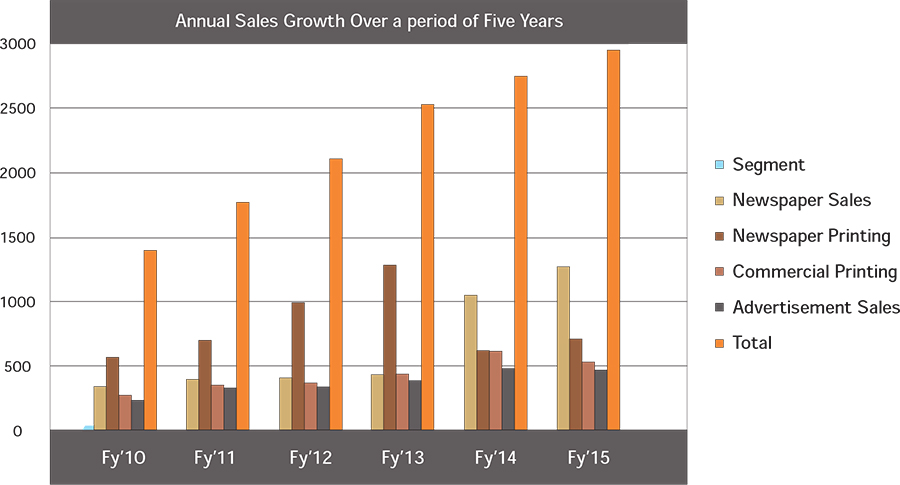
| Newspaper Sales | 329.24 | 397.81 | 403.54 | 426.06 | 1,039.25 | 1,252.89 | 280.54% |
| Newspaper Printing | 564.81 | 688.42 | 983.94 | 1,276.38 | 614.30 | 698.69 | 23.703% |
| Commercial Printing | 266.40 | 349.09 | 366.22 | 431.31 | 608.06 | 520.93 | 95.54% |
| Advertisement Sales | 228.60 | 321.34 | 338.21 | 376.53 | 474.42 | 461.32 | 101.80% |
| Total | 1,389.05 | 1,756.66 | 2,091.91 | 2,510.28 | 2,736.03 | 2,933.83 | 111.21% |
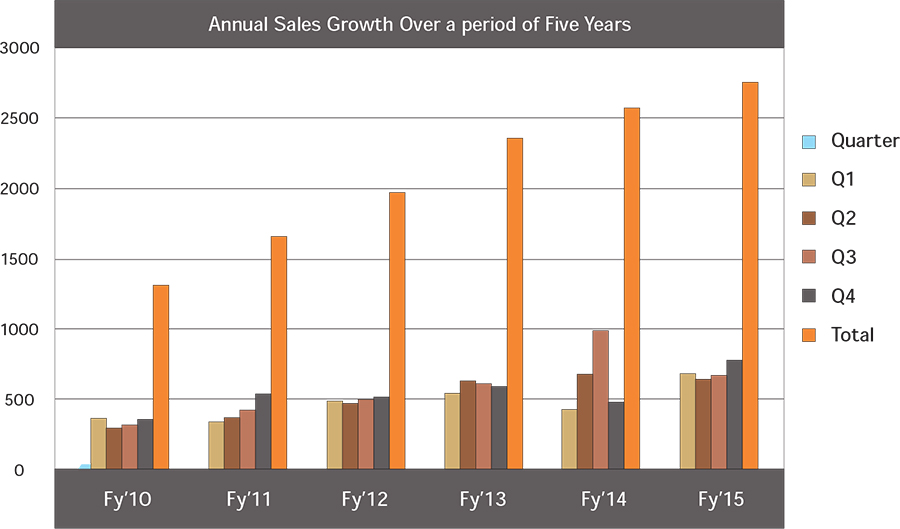
Quarterly Sales Growth
| Quarterly Sales Growth | |||||||
| Sales | FY’ 10 | FY’ 11 | FY’ 12 | FY’ 13 | FY’ 14 | FY’ 15 | Growth Over 5 Years |
| Segment | Figures in Lacs (INR) | ||||||
| 01 | 378.52 | 359.18 | 516.91 | 575.94 | 454.46 | 718.03 | 89.69% |
| 02 | 310.42 | 384.60 | 500.96 | 657.45 | 719.37 | 685.90 | 120.96% |
| 03 | 326.28 | 445.92 | 528.01 | 653.30 | 1,055.89 | 704.89 | 116.04% |
| 04 | 373.83 | 566.97 | 546.03 | 623.59 | 506.31 | 825.01 | 120.69% |
| Total | 1,389.05 | 1,756.67 | 2,091.91 | 2,510.28 | 2,736.03 | 2,933.83 | 111.21% |
Financial Highlights
| Financial Highlights | ||||||||
| Financial Components | FY’ 10 | FY’ 11 | FY’ 12 | FY’ 13 | FY’ 14 | FY’ 15 | Growth Over 5 Years | |
| Figures in Lacs (INR) | ||||||||
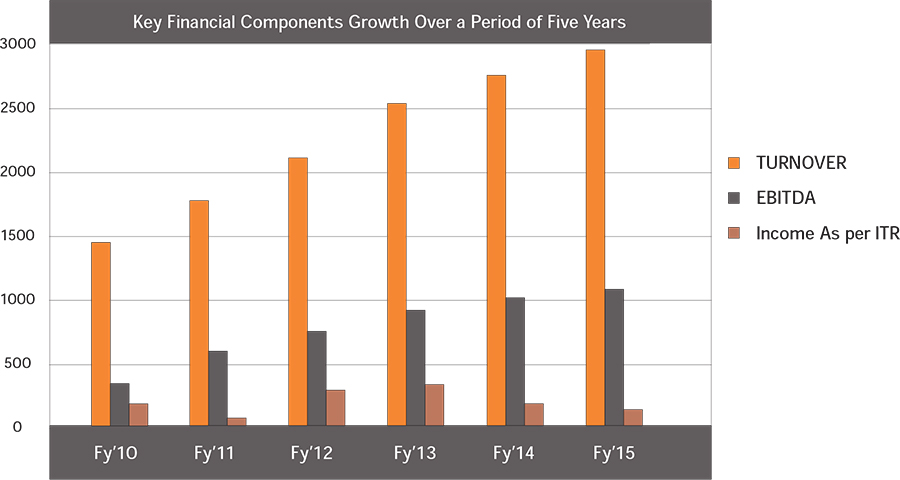
| TURNOVER | 1,389.05 | 1,756.66 | 2,091.91 | 2,510.28 | 2,780.22 | 2,933.83 | 111.21% | |
| EBITDA | 298.47 | 578.05 | 741.65 | 901.11 | 1,056.75 | 1,064.88 | 256.78% | |
| Income As per ITR | 150.43 | 63.09 | 274.40 | 317.73 | 166.88 | 123.90 | -17.64 | |
