performance-at-glance backup
| COMPANY PERFORMANCE AT GLANCE | |||||
| Year | Turnover(INR) | Growth in Turnover | Net Profit After Depreciation(INR) | Growth in Profit(%) | Income Tax(INR) |
| 2000-01 | 40,67,594.00 | 64,256.00 | 33,090.00 | ||
| 2001-02 | 78,59,881.00 | 93.23 | 1,84,739.00 | 187 | 78,433.00 |
| 2002-03 | 1,76,30,281.00 | 124.31 | 21,94,453.00 | 1087.87 | 9,21,870.00 |
| 2003-04 | 2,81,35,508.00 | 59.59 | 24,10,964.00 | 9.87 | 9,11,684.00 |
| 2004-05 | 3,42,33,829.00 | 21.67 | 29,66,616.00 | 23.05 | 11,42,638.00 |
| 2005-06 | 4,12,39,778.00 | 20.46 | 45,45,217.00 | 53.21 | 11,48,852.00 |
| 2006-07 | 7,35,66,188.00 | 78.39 | 58,18,044.00 | 28.00 | 21,43,347.00 |
| 2007-08 | 1,14,724,556.00 | 55.95 | 1,27,98,383.00 | 119.98 | 43,07,936.00 |
| 2008-09 | 1,59,770,558.00 | 39.26 | 1,70,63,679.00 | 33.33 | 53,37,271.00 |
| 2009-10 | 138,903,641.44 | -13.06 | 15,042,610.00* | -11.84 | 5,112,983.00* |
| GRAND TOTAL | |||||
As a Company, Darpan Publications Pvt.Ltd. has grown in leaps and bounds in the last 9 Years. Within a span of Eight Years(2001-09) Dppl’s sales has risen by over 39 times whereas profits spurted by over 265 times. This is a remarkable growth story. And, it was not achieved by a reckless spirit of adventure but by adopting a well calibrated business strategy.
In FY’10 the Company had undergone Business restructuring to streamline operations and create shapes focus on execution. The Company resorted to various Cost Control Measures and identified high potential Areas. Under our restructure programme, we sold our Kolkata Unit which was depending merely upon few clienteles and deriving very insignificant profit. Hence, in FY’10, our Sales declined to the extent of 25% and profit to some extent, But through a structured focus on rescheduling loans and selling kolkata Units, we have considerably deleveraged the Company and the asset-liabilty gap has been considerably bridged. the company today is a relatively much stronger financial position.
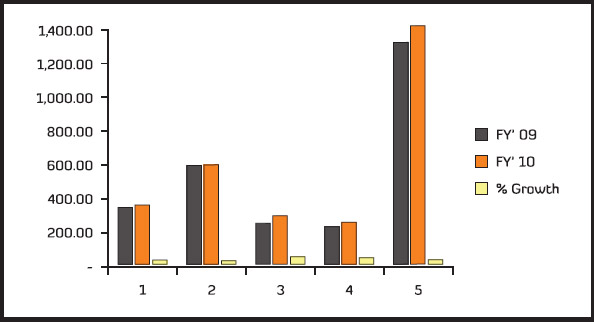
| COMPARATIVE SALES VOLUME -ANNUAL | |||||
| Sales | FY’09(Including Kolkata Unit) | FY’09(Only Kolkata Unit) | FY’09(Excluding Kolkata Unit) | FY’10 | % Growth |
| News Paper Sales | 311.76 | - | 311.76 | 329.24 | 5.61 |
| News Paper Printing | 868.15 | 307.00 | 561.15 | 564.81 | 0.65 |
| Heidelberg Printing | 215.84 | - | 215.84 | 266.40 | 23.42 |
| Advertisement | 201.96 | - | 201.96 | 228.60 | 13.19 |
| Total | 1,597.71 | 307.00 | 1,29.71 | 1,389.05 | 7.62 |

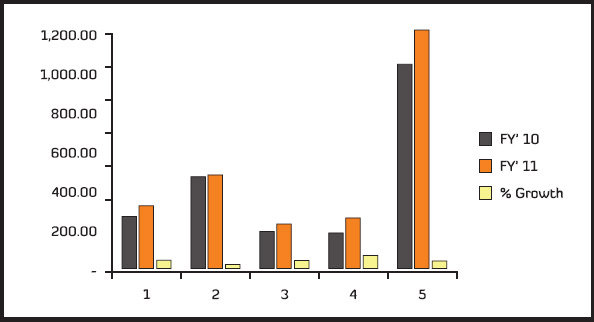
| COMPARATIVE SALES FOR THE PERIOD FY’10(APR-DEC’09, AUDITED) – FY’11(APR-DEC’10 PROVISIONAL) | |||
| Sales | FY’10 | FY’11 | % Growth |
| News Paper Sales | 243.23 | 297.45 | 22.29 |
| News Paper Printing | 439.87 | 452.52 | 2.88 |
| Heidelberg Printing | 170.70 | 207.26 | 21.42 |
| Advertisement | 161.42 | 235.72 | 46.03 |
| Total | 1,015.22 | 1,192.95 | 17.51 |
